Network functions have evolved from traditional multi-vendor devices (mips, x86, np) without uniform standards on physical machines to uniform physical machines based on the x86 server. Upper-layer applications were virtualized and continued to evolve into cloud and cloud native. In just 10 years, 4G has evolved into 5G, and 5G will be matured in 2020.
With 4G evolving into 5G, traditional telecom equipment has evolved into the virtualization and cloudification era, and the hardware and software architecture has undergone tremendous changes. The telecommunications industry has introduced many IT software architectures, ideas, and methods. Open source, APPs, and infrastructure decoupling bring lots of benefits and convenience to telecom applications, and also bring new problems which have great impacts on telecom O&M modes.
In the case of 2G/3G/4G traditional equipment, once the service is faulty, the O&M personnel does not need to distinguish hardware fault and software fault. The equipment should first perform active/standby switchover of both software and hardware to recover the service, and then locate the fault.
In the current cloud era, infrastructure is centralized. Physical devices of the central DC are large in scale (>1000), and network functions are distributed on different physical nodes. Once a fault occurs, the original active/standby switchover mode is no longer effective. In this case, more effective automatic identification capability is required to quickly identify the fault root cause, which is due to hardware, cloud platform or upper-layer VNF, so that, the fault can be effectively isolated and recovered.
Implementing automatic and intelligent network O&M is a key technology for 5G maturity. Intelligent monitoring and fault analysis are critical for automatic O&M.
1. Intelligent Monitoring
The purpose of intelligent monitoring is to automatically detect system operation errors and trigger the next step of fault analysis, so as to locate the root cause of system errors and quickly fix faults.
Intelligent monitoring can be implemented in two modes: direct mode and indirect mode.
Direct mode is to directly monitor the indexes of environment, hardware (computing, storage and network), Cloud OS and other key facilities. Once abnormal data occurs, the system directly raise a alarm and locate the fault.
Indirect mode is to monitor KPIs of 5G services and make comparative analysis from multiple dimensions, and then judge whether a fault occurs, so as to trigger further fault association analysis and location. The multi-dimensional comparison analysis can be performed from the following aspects:
- History data comparison mode. The O&M system implements comprehensive history data analysis per day, week, month, year, and holiday. It provides KPI prediction data of the next phase (hour and day) in advance through the AI algorithm, and then determine whether the system is abnormal based on the data collected in real time.
- Similar comparison mode. The change of same KPIs of 5G NFs of the same kind should be consistent. Once a large fluctuation (beyond the threshold) occurs, the system can be judged as abnormal. Within a single NF, the processing KPIs of different microservices should also be the same. If they are different, the system can also be judged as abnormal.
2. Fault Analysis
Fault root analysis can start from two aspects: alarms and logs. After the supervision system detects that the system is abnormal, it triggers vertical hierarchical alarms and hierarchical log association analysis. At the same time, it implements horizontal association analysis among micro-services and among NFs, to locate the fault source.
(1) Vertical association
Vertical association is based on the vertical architecture which includes physical layer, virtual layer, and application layer. If the underlying layer is faulty, upper-layer services are affected.
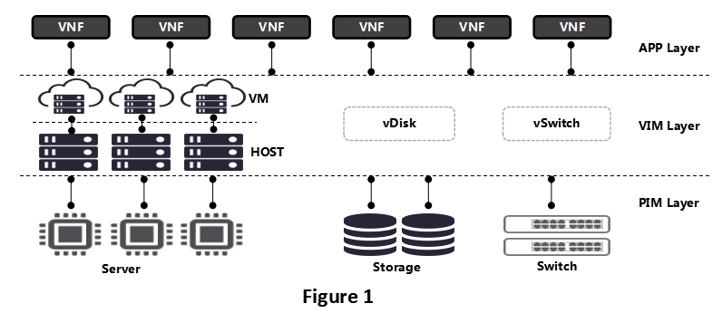
Figure 1 3-Layer Architecture
Key problems solved by vertical association: Once a fault occurs on the underlying hardware or virtual layer, upper-layer service KPIs will be abnormal. Vertical association associates upper-layer service exceptions with underlying faults to identify the location of fault root (PIM layer, VIM layer, or VNF service itself).
(2) Horizontal association
- At the horizontal level, there is service flow correlation and mutual influence among internal micro-services of the VNF. The horizontal correlation is used to find out the micro-service where the root cause is located.
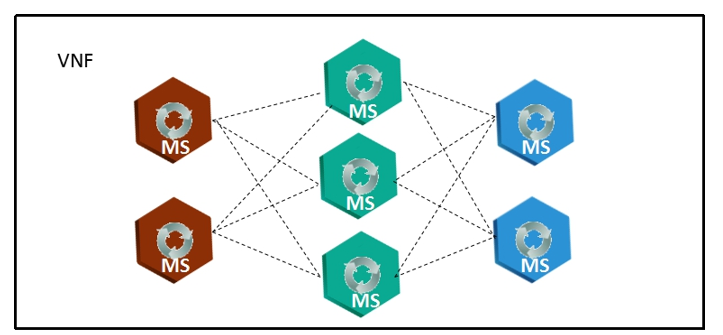
Figure 2 Different Micro-Services Clusters in One VNF
- When the service flow between VNFs flows through different nodes, if a node fails, other related nodes will also be affected, as shown in Figure 3. For example, AMF, SMF, PCF, and UDM are different nodes of the service flow, and they are impacted by each other.
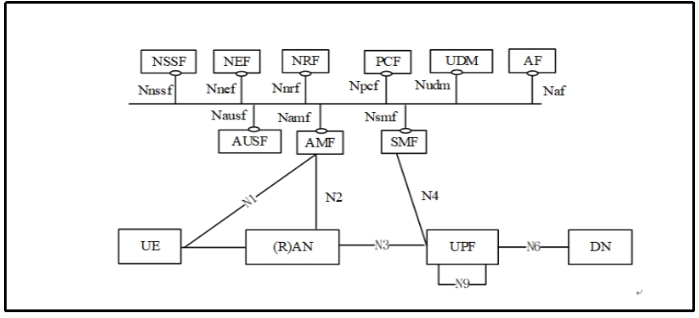
Figure 3 Interconnection of Different VNFs
It can be concluded that horizontal association is to associate the fault of one VNF with the fault of another service-related VNF, and associate the fault of one micro-service with the real faulty micro-service. In this way, it identifies the micro-service or component that is really faulty at the application layer.
3. Common Technologies
Common technologies include: data collection, data classification (cleaning), data monitoring, data association, and layer-by-layer positioning.
- Data collection: Service alarm, service KPI, service configuration operation log, network device operation log, storage device operation log, virtual device operation log, virtual layer platform operation log, virtual layer system operation log, etc.
- Data classification: There are several labels for data cleaning and classification, such as time, location, whom I influence (classification label), who influences me (classification label). Classification labels include network, host, storage, and configuration.
- Data monitoring: In general, the upper-layer KPI is monitored. KPI data is statistical data. The AI algorithm can be introduced to judge abnormal KPIs. Once abnormal data occurs, the system will be judged as faulty and the fault root cause analysis system is triggered.
- Data association: It is based on the preset template. Templates are associated by labels. Location, time, whom I influence and who influences me is the main basis for data association.
- Layer-by-layer positioning: The final associated node is determined from top to bottom (application layer, virtual layer, and physical layer) through data association. Through "classification labels", horizontal association locates the VNF, micro-service or component of root cause.
Key technologies of automatic O&M include fault monitoring, fault root analysis, fault self-healing, global perspective, all-round cross-domain data collection, network topology management, one-click automatic tests, and one-click automatic service deployment. They are all mature commercial capabilities for intelligent O&M. Intelligent and simplified O&M can reduce the complexity of system maintenance brought by 5G cloud native and service-based software architecture, and focuses on 5G services
ZTE supports AI with full-stack IT offering
5GC Green Engine Solution to Enable Green Internet of Everything in the Dual-Carbon Era
5GC Private Network 2.0 Empowerment and Efficiency Improvement Boosts High-Quality Development of the Industry
5G Empowers Intelligent Mining for High-quality Development of Shaanxi Coal Caojiatan Mining
ZTE and China Mobile embrace digitalization for biodiversity conservation in Panda Reserve
Three Aspects Contribute to ZTE’s Remarkable Breakthroughs in Advanced G4X Server
How 5G Private Networks Are Poised to Transform Enterprises Worldwide: All Scenario Private 5G Helps Operators to Realize Private 5G as a Service
ZTE’s commitment to servers generates robust growth of up to 60 times in past 8 years
ZTE eyes top 5 global server market share
Full-Scenario One-Stop 5G Private Network for Vertical Industries